Medical Visualization – Enabling A Revolution In Healthcare
Human brains are highly biased towards processing visual information. In fact it is said that visual sensory input contributes to 70% of the total input that we process. No wonder we have a very wise and old adage “A picture is worth a thousand words”. “We were never born to read,” says neuroscience and reading researcher, Maryanne Wolf, in her book, Proust and the Squid: The Story and Science of the Reading Brain. So, let us see how visualization has impacted healthcare.
What exactly is medical visualization?
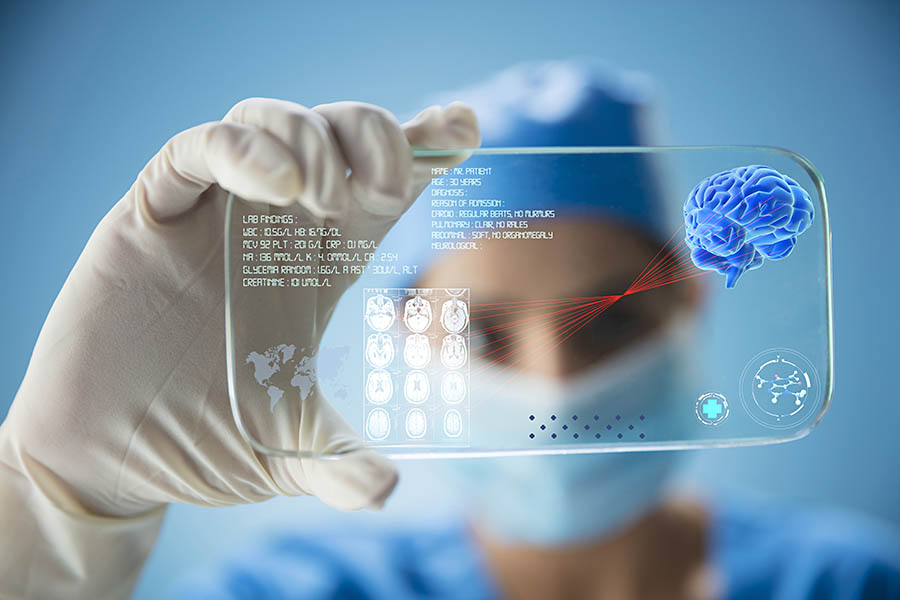
Medical visualization deals with the analysis, visualization, and exploration of medical image data. Computers are used to create 3D images from medical imaging data sets.
How has data visualization improved healthcare?
Data visualization tools give us the ability to process information faster and to use that information to boost productivity and results.
Medical administrators can acquire actionable insights and valuable takeaways to drive reasonable change. Some are listed below:
- Improved patient care for clinics and medical centers: Changes in patient satisfaction levels are easy to track.
- Professional-grade visualization for medical devices: Visualization of anatomical structures has been steadily improved due to the progress in image acquisition, graphics and computing hardware, and better rendering.
- Improved access to data insights for physicians: Data visualization dashboards can be used by medical practitioners to generate various types of diagrams and charts. They can, for example, be used to…
- Visualize performance and hours spent with individual patients or certain medical activities (personal consultations/ sessions, telemedicine and more.)
- View statistics and data for each patient’s conditions, treatment plans, and outcomes.
- Trends and pattern recognition in healthcare activities
- One can discover declines, inclines, or plateauing in certain disease incidences.
- Find relevance to seasonal, gender, social, economic, and other factors.
- Draw prognosis for future periods based on current trends and data patterns.
- Various levels of medical data presentations
Visualizing and interpreting medical data required sufficient mathematical skills earlier to 3D Visualization. With the help of custom clinical data visualization tools, charts, popular infographics are built automatically along with auto-generated analytical conclusions like potential disease symptoms and prevention methods. - AI-powered predictive analytics in healthcare
With AI and ML technologies, visualizations can also help predict future situations in healthcare. For example…- Spikes or decreases in diseases and health problems based on trends, patterns, and factors.
- Expected efficiency of certain treatment plans and methods in specific patient groups.
- Interactive custom dashboards
Uses of Medical Visualization
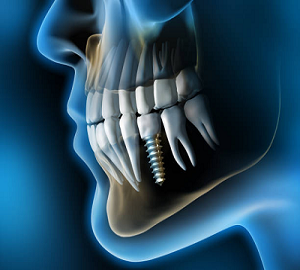
- Diagnosis: One can get an overview of the morphology of the patient situation who may be very unusual (complex fractures, defective positions).
- Modern medicine: Almost all surgery and cancer treatment in the developed world relies on 3D visualization.
- Neuroscience and Biomechanics
New diffusion imaging techniques reveal the diffusion of water through the body, blood perfusion. - Healing time: Health care practitioners can examine the data of other patients who have experienced the same symptoms.
- Treatment planning: Interactive 3D renderings of anatomical and pathological structures improve surgical, radiation, and minimally invasive intervention planning. With 3D visualizations, the spatial relationships between diseased lesions and life-critical structures at risk can be properly assessed.
- Prevention: Helps medical professionals to step ahead into possible future diseases and explain the triggers of past illnesses and harmful conditions.

Almost all physicians, nurses, and even patients can benefit from data visualization tools and approaches, thanks to the global digitization of healthcare.
Interested in implementing data visualization in your health care process? You are a step away.
ProtoTech Solutions can help you design, develop, and/or implement a medical data visualization tool. We have deep expertise in engineering interoperable healthcare software.
We at ProtoTech can tackle challenges that Healthcare Organizations face in the process of visualizing data.