2 Powerful Tools to improve code quality
Good Code quality is vital for any business that depends on software. I have been using two very powerful tools to improve my code quality and increase my productivity (to be used along with Visual Studio). You may find it available on internet but let me write them down my experience and how they work. These tools can help you and your development team to develop and maintain high standards of code excellence
I) Visual Leak Detector:
It detects memory leak present in code and provides the exact line of cause. There are some other tools available in marker but most of the really popular ones, like Purify and BoundsChecker, are very expensive. A few free alternatives exist, but they’re not fully reliable.
Steps to use:
- Download and install the Visual Leak Detector tool
- Modify the project settings to integrate the tool with your project
- Add the ‘vld.lib’ in the Linker Input option
- Add path for the ‘vld.lib’ to the Additional Library Directories option
- Add the path of ‘include’ directory for Visual Leak Detector under Additional Include Directories option
- Include the ‘vld.h’ file in your source code file which has the entry point for your application
- Call function VLDGlobalEnable() within the code from where your application beings
This function Enables memory leak detection at runtime in all threads - Call function VLDReportLeaks() within the code which is the exit point of your application
This function report leaks up to the execution point
Once you run your application under the Visual Studio debugger then Visual Leak Detector will list all the memory leaks in the output window at the end of debugging session. The leak report includes the full call stack showing how any leaked memory blocks were allocated. Double-click on a line in the call stack to jump to that file and line in the editor window.
Useful Links:
Overview: http://vld.codeplex.com/
Download: http://vld.codeplex.com/releases/view/120547
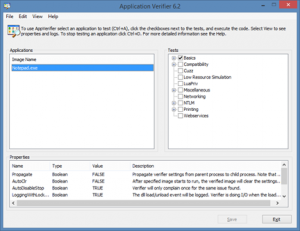
II) Application Verifier:
It finds an error in an application that is difficult to be found during testing. Using Application Verifier in Visual Studio makes it easier to create reliable applications by identifying errors caused by heap corruption, incorrect handle, and critical section usage. Application Verifier can be used with any project in the C++ language.
Steps to use:
- Download and install the Application Verifier tool(Note: Use Internet Explorer to download the software as download process won’t start at all in Chrome or other browsers)
- Launch the Application Verifier executable and add your application which you want to test using File menu or clicking Ctrl + A
- Select different option for testing from Tests section on the right side
- Click the Save button to save your settings
- You can test your application in two ways:
- Using Visual Studio Debugger:
- Once you run your application under the Visual Studio debugger then Application Verifier will break the execution and will list the issue in output window
- Also, you can view the log in the Application Verifier for more details like particular source file and line causing problem
- You can continue the execution stopped by Application Verifier
- Stand-alone executable:
- Now launch your application and perform some operations
- Application Verifier will list the issues observed in a log which presents under View menu
- Using Visual Studio Debugger:
For Windows 8 you don’t need to download and install the tool as it is already present under windows directory at C:\Windows\System32 and C:\Windows\SysWOW64
Useful Links:
Overview: https://msdn.microsoft.com/en-us/library/windows/desktop/dd371695(v=vs.85).aspx
Download: https://www.microsoft.com/en-us/download/details.aspx?id=20028
Screenshot:
Author: Vijay S
Contact us:
info@prototechsolutions.com
ProtoTech Solutions
