
Apply Machine Learning to 3D Data in 5 Quick Steps
What is Machine Learning?
Machine Learning can be defined as a field of study that gives computers the ability to learn without being explicitly programmed.
Typically any ML problem can be broadly classified in two categories:
- Supervised Learning
- Unsupervised Learning
What is Supervised Learning?
Supervised learning can be adopted for data, where we already know what our correct output should look like.
Simply put, it means that given a problem of identifying whether given image is of male or female, We label the images as male or female & then train the model accordingly.
What is Unsupervised Learning?
Unsupervised learning can be applied for problems about which we have little or no idea what our results should look like.
We can organize the unstructured data.
We can perform clustering on the unorganized data to find structure in it.
Clustering means grouping similar entities together in unorganized data
Unlike in supervised learning, there is no feedback based on the prediction results in unsupervised learning.
What is Point Cloud?
A point cloud is a set of data points in a predefined coordinate space. Many modern 3d scanners primarily output the data as 3d point cloud. Point cloud of an object can be used for a number of applications such as creating a 3D CAD model, visualization etc.
Considering the wide range of application of point clouds, Clustering the point cloud data is crucial as it gives structure to unstructured point cloud data.
Clustering Algorithms:
There are multiple algorithms available for clustering the data. Some of them are as follows:
- K-Means
- Mean shift clustering
- DBSCAN
K-means clustering is one of the simplest and most popular unsupervised machine learning algorithms.
You can find a really nice explanation about k-Means here :-> https://en.wikipedia.org/wiki/K-means_clustering
For this post we will be using python implementation of k-Means from scikit package.
Now let’s see how to cluster point clouds using k-Means algorithm.
This script imports input point cloud file & exports separate clustered point cloud files.
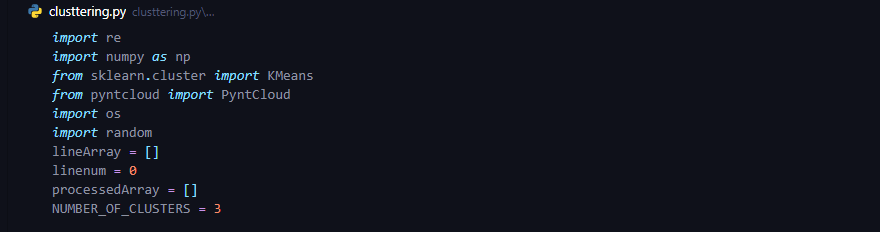
Step 1: Import dependencies & declare constants & variables.
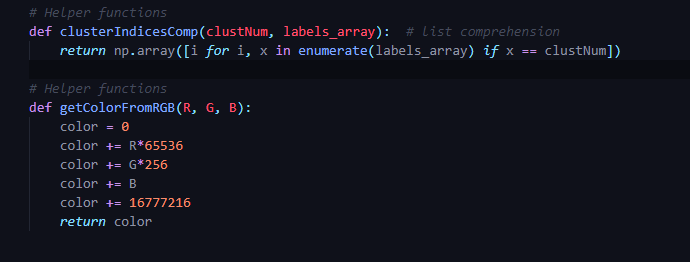
Step 2: Helper functions for assigning color to clustered point clouds.
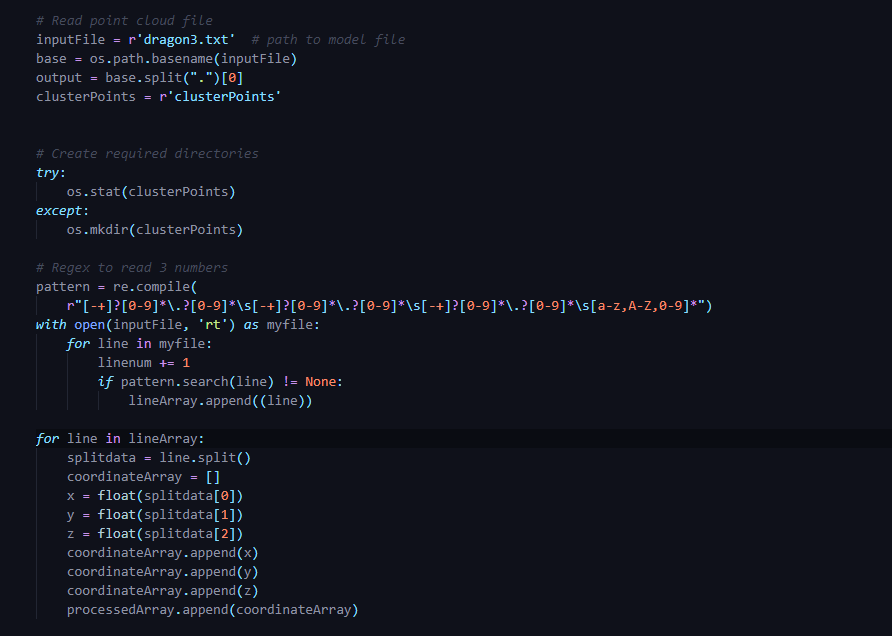
Step 3: Read input point cloud file & store it in nparray.
Step 4: Run k-Means on the input data.

Run k-Means on stored array. Here in n_clusters you can specify the number of clusters to form as well as the number of centroids to generate.
Random_state determines random number generation for centroid initialization
Detailed documentation of scikit implementation of
KMeans can be found here :-> https://scikit-learn.org/stable/modules/generated/sklearn.cluster.KMeans.html
Step 5: Extract clusters from cluster centers
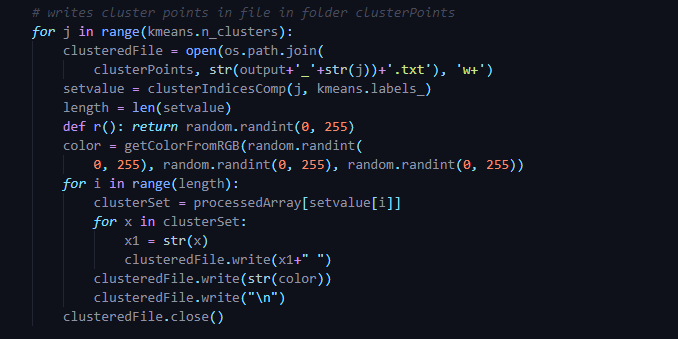
Once we get cluster centers of the data, we want the points which represent that cluster centers. Above piece of code does exactly the same. It extracts points associated with particular cluster & writes it in separate txt file for each cluster. As for this example we are clustering the data in 3 clusters, so in the end we will get 3 clustered point clouds written in 3 separate files where each file represents a different cluster.
The input point cloud file contains point cloud of
- Sphere
- Sphere
- Torus
After successful clustering we expect to see these 3 shapes separately written in corresponding txt file.
Here is a snapshot of point cloud before clustering
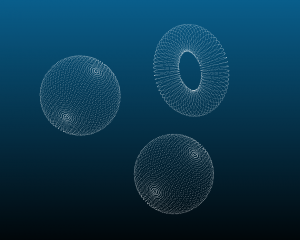
point cloud before clustering
Once clustering is completed we can see 3 distinct clusters represented by three colors
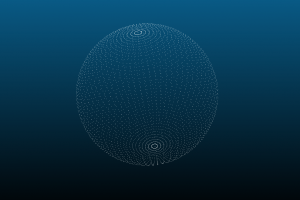
Sphere
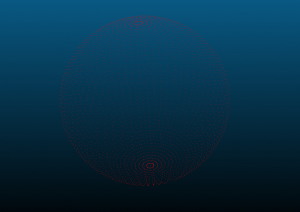
Sphere
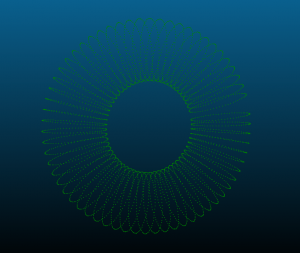
Torus
As we can see, without explicitly specifying the shape & size the expected clusters, k-Means successfully organized the shapes to correct cluster.
Credits:
Software Used for visualizing 3D Point Cloud : CloudCompare :-> https://www.danielgm.net/cc/
For more blogs, please visit us at https://prototechsolutions.com/cad-notes/
Author: Omkar P
Contact us: info@prototechsolutions.com
ProtoTech Solutions and Services Pvt. Ltd.


